-
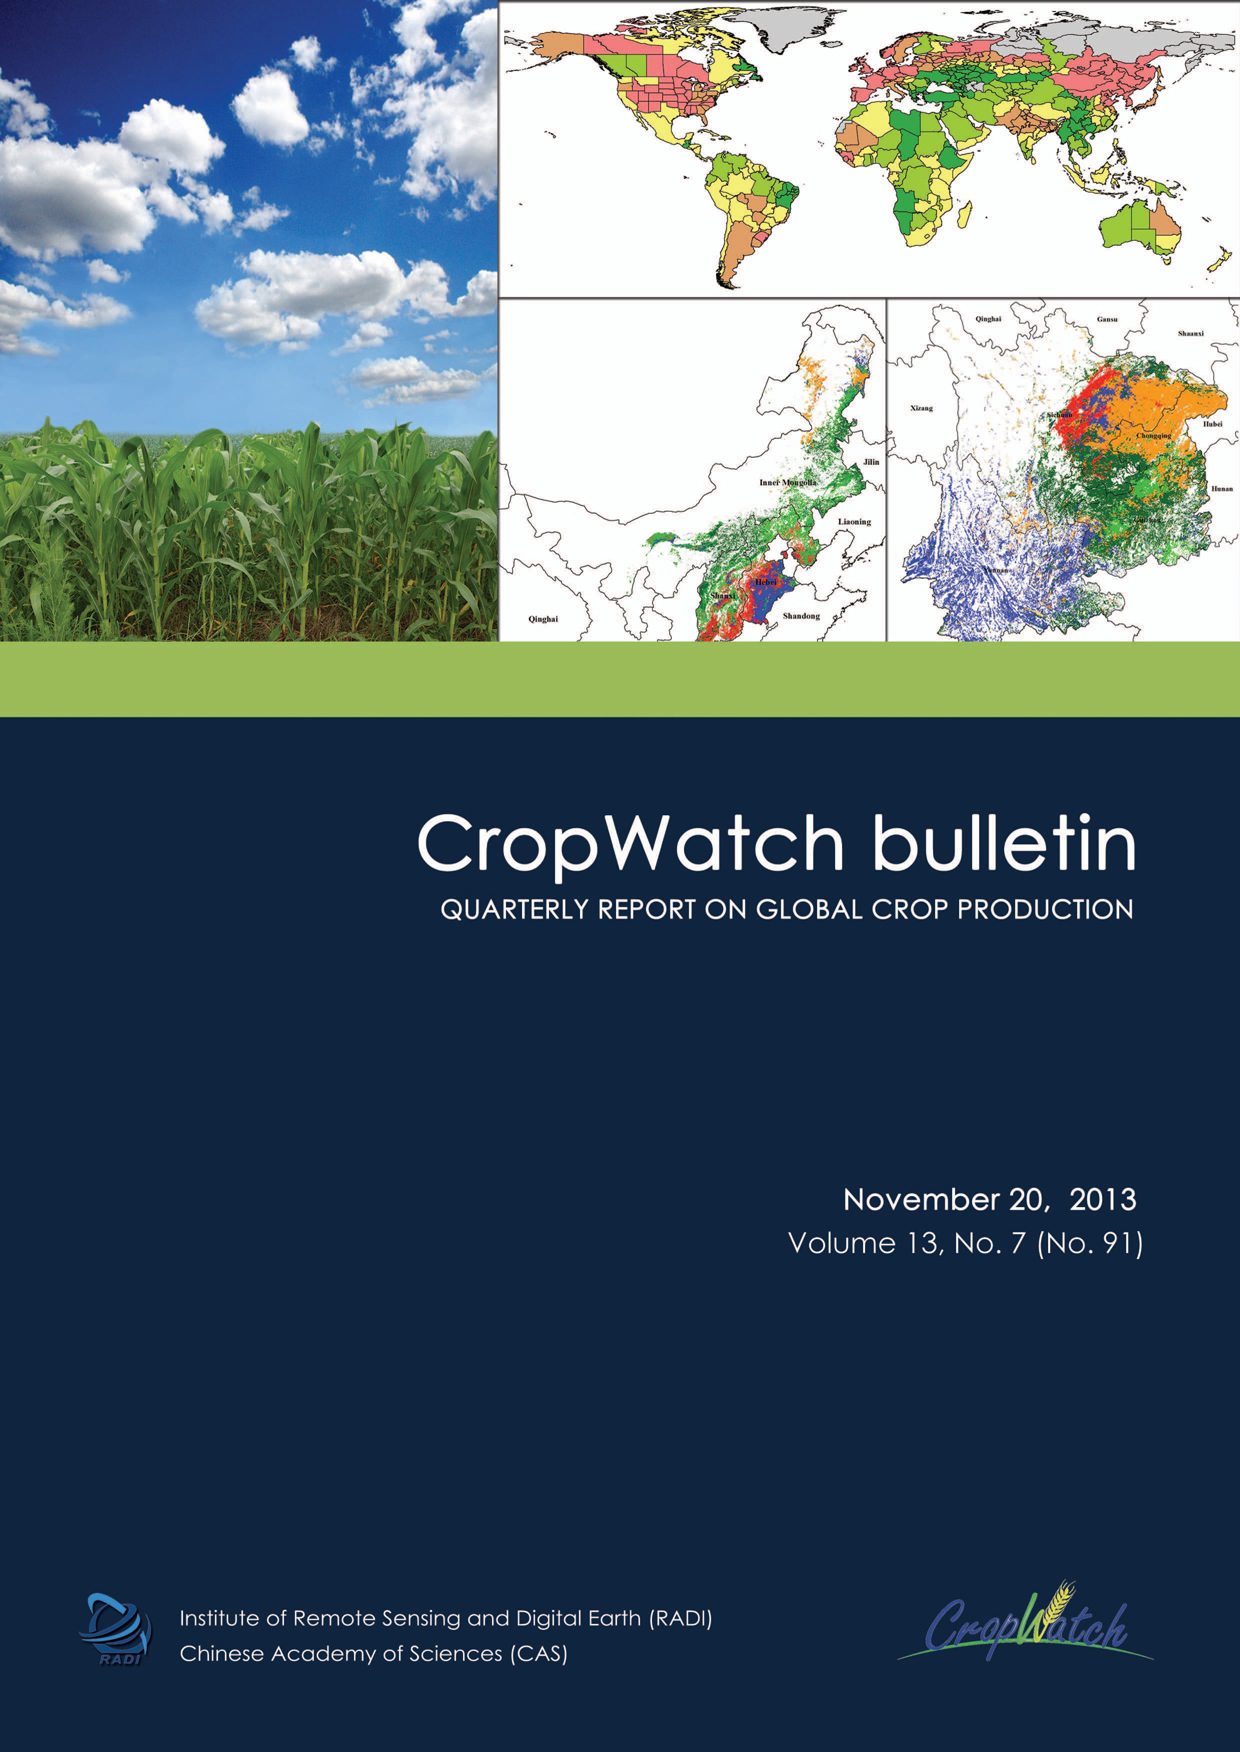
The November 2013 CropWatch bulletin provides a comprehensive overview of the 2012-13 global production of wheat, rice, maize, and soybean. It is based on a thorough analysis of environmental conditions and a quantitative assessment of their impact on crops, focusing on some of the major production areas and countries, including China. The CropWatch analysis presented in the report takes advantage of newly available data, including the high quality data from the Chinese FY-3 and HJ-1 satellites, and introduces new spatial units of analysis, new methods, and several innovative remote sensing-based indicators. The report marks CropWatch’ first systematic contribution to GeoGLAM and the G20 Agricultural Market Information System (AMIS) and for the first time is released in both English and Chinese.
Key messages from the report:
- According to CropWatch estimates, the 2012-13 season is best described as globally average for rice, soybean, and maize, while wheat did generally better.
- CropWatch estimates for the production of main crops is as follows: wheat, 705 million tons, up 4.1 percent over 2012 estimates; rice (paddy), 739 million tons, up 1.6 percent; maize, 944 million tons, up 0.3 percent; and soybean, 282 million tons, an increase of 1.2 percent compared with 2012.
- For China, CropWatch estimates are: wheat, 118 million tons (17 percent of world production), a slight decrease of 1.3 percent over last year’s output; rice, 200 million tons (27 percent of world production), slightly up (+0.6 percent); maize, 194 million tons (21 percent of world production), slightly up (+3.1 percent); and soybean, 13 million tons (just below 5 percent of world production) and down 6.8 percent compared to last year.
- Two dominant weather patterns seem to have influenced production: a persistent cold wave across much of the northern hemisphere, as well as a series of tropical storms in Southeast Asia.
INTRODUCTION
China’s global crop monitoring began in 1998 with the development of CropWatch, a system designed to assess national and global crop production and related information using remote sensing and ground based indicators. The introduction briefly introduces CropWatch, international collaborations, and the CropWatch bulletin.DownloadCHAPTER 1
Chapter 1 presents CropWatch findings for three environmental indices—rainfall, temperature, and photosynthetically active radiation (PAR)—for each of sixty Crop Production System Zones (CPSZ). These zones are defined based on prevailing ecological conditions, which are associated with typical climate and cropping patterns.Download- Chapter 1 Crop Production System Zones: Environmental Indices
- Annex A Concise Definition of Crop Production System Zones
- Annex B Environmental Indices for Crop Production System Zones
CHAPTER 2
Chapter 2 describes four of the world’s major production zones (MPZ). Chosen mainly because of their contribution to world exports, the four zones are located in South and Southeast Asia, North America, South America, and Central Europe-West Russia. In addition to the environmental indicators used in chapter 1, four additional indicators have been used to analyze cropping activities and stress in the four MPZs: uncultivated arable land (UAL), cropping intensity, potential biomass ratio (PBR), and the Vegetation Health Index (VHI), a drought indicator.Download- Chapter 2 Major Production Zones: Cropping Activities and Stress
- Annex C Environmental Indices and Crop Indicators for Major Production Zones
CHAPTER 3
Chapter 3 presents 2013 global and national crop production for wheat, rice, maize, and soybean, comparing it to preliminary 2012 FAOSTAT estimates. The chapter also describes cropland use intensity—covering cropping intensity, percentage of uncropped arable land, and the potential biomass ratio—for thirty key countries and China.DownloadCHAPTER 4
While the previous chapters rely a lot on remote sensing and ground data, chapter 4 discusses two subjects by providing overview information mostly based on international databases and general information, with less systematic reference to remote sensing indicators. Section 4.1 focuses on rice in Southeast Asia, discussing crop and weather conditions, adverse factors, production and trade, and relevant policy trends in the region. Section 4.2 discusses extreme factors that have affected countries and more specifically crops over the last year.DownloadCHAPTER 5
Chapter 5 presents 2013 production and crop condition for China. Results are presented for the country as well as for six production regions—North, Northeast, East, Central and South, Southwest, and Northwest China—using the environmental and cropland use intensity indicators for rainfall, temperature, PAR, cropping intensity, uncropped arable land, and the potential biomass ratio.DownloadCHAPTER 6
Chapter 6 presents relevant background information for the results presented in the bulletin. Section 6.1 describes the spatial units of analysis, in particular the Crop Production System Zones adopted for chapter 1 and the Major Production Zones described in chapter 2. Section 6.2 gives a detailed account of the raw data used for the report, while 6.3 lists other methodological details.DownloadANNEXES
The annexes contain a maps and tables that complement those shown in other parts of the bulletin.Download- Annex A Concise Definition of Crop Production System Zones
- Annex B Environmental Indices for Crop Production System Zones
- Annex C Environmental Indices and Crop Indicators for Major Production Zones
- Annex D Environmental Indices and Production Estimates by Country
- Annex E China Production Estimates and Environmental Indices
- Annex F Country Profiles
- Annex G Country Long Term Trends
- Data Notes and Bibliography
- Acknowledgements

