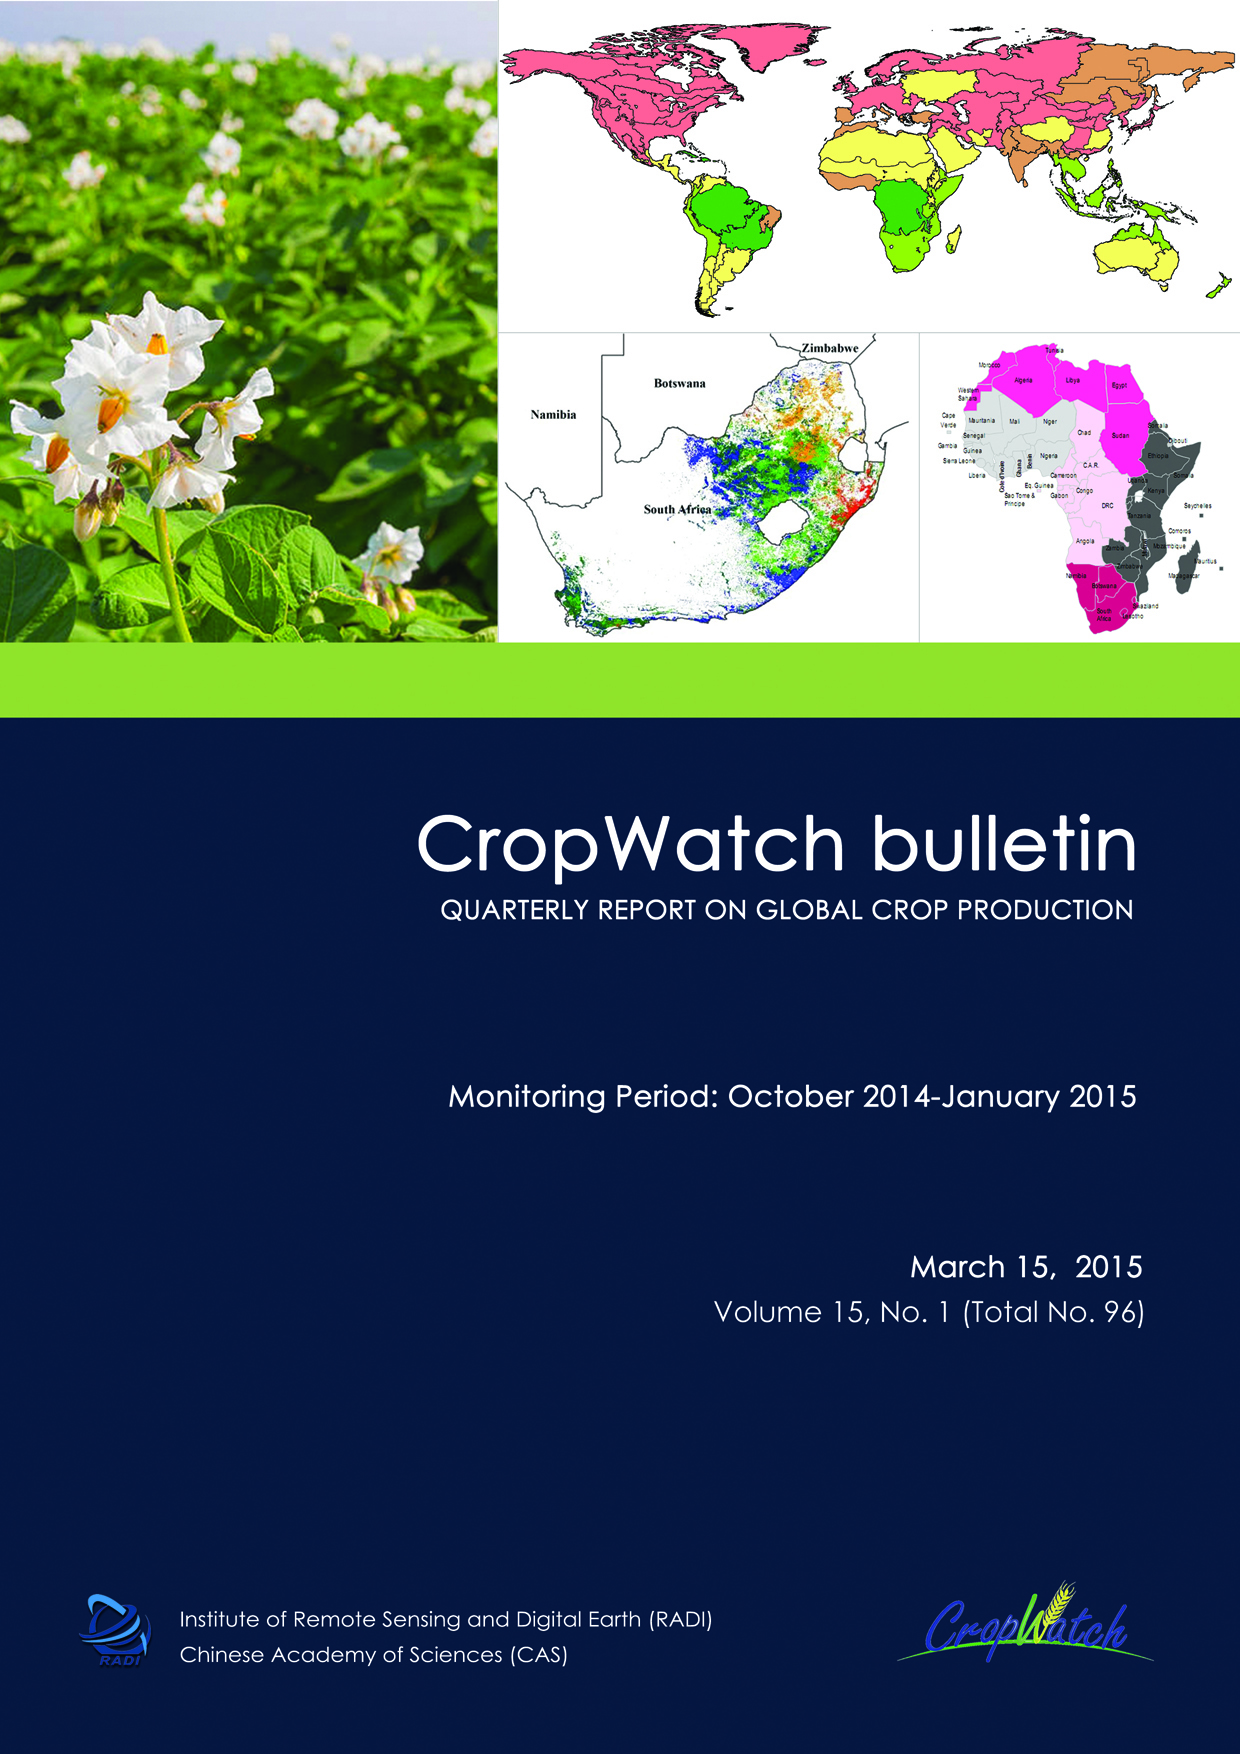
-
February 2015 CropWatch bulletin released. The CropWatch February 2015 bulletin presents an overview of global and regional crop development and agricultural production up to the end of January. The bulletin’s analyses of agroclimatic and satellite-based agronomic indicators focus on worldwide patterns and zoom into major production areas, countries, and large administrative areas. Although the latest reporting period covers a relatively quiet period from an agricultural standpoint, as described in the bulletin global weather and extreme weather events have caused damages to agriculture or will otherwise impact agricultural outcomes for the next season. The bulletin includes updated estimates for wheat production in Argentina, Brazil, and Australia, as well as a focus section on agricultural development in Africa.
Key messages from the report:
- The revised estimate for 2014-15 wheat production in Argentina is +14.8% compared to 2013. Revised estimates for Brazil and Australia are +9% and -9%, respectively.
- Global agroclimatic patterns from October to January were mainly characterized by a significant deficit of sunshine in the northern hemisphere and India.
- Above average temperature has affected eastern South America, the western United States, and Western Europe; droughts occurred in the south of Europe and the Mediterranean Basin, northeast India, Bangladesh, China, and Japan. In China, Taiwan (with a 84% decrease in rainfall compared to average), Jiangxi province (-67%), and Zhejiang province (-65%) were most affected.
- Abundant precipitation and severe cold conditions prevailed around the Caspian Sea and in western Russia, resulting in maximum Vegetation Condition Indices (VCIx) among the lowest in all major crop production zones. While VCIx was also low in Southern Australia, the index was above 0.85—indicating good condition—in other major production zones.
- In China, about 15% of agricultural land in the south and southeast suffered from drought and mostly above average temperature, especially during January. A reduction in cropped arable land fraction occurred in the Loess region.
- Possibly unfavorable conditions for crop growth are reported for: Australia, Egypt, Pakistan, Russia, South Africa, Turkey, and Ukraine.
Introduction
This CropWatch bulletin summarizes global crop condition developments and agroclimatic factors from October 1 2014 to January 31 2015. Chapters 1 through 4 zoom in from a global overview of agroclimatic indicators (Chapter 1) to detailed descriptions of crop and environmental conditions in major production zones (Chapter 2) and individual country analyses covering 30 major producers and exporters (Chapter 3) and China (Chapter 4). A special focus section is included in Chapter 5. This first part of the report includes the cover, table of contents, abbreviations, and a short overview of the different sections of the bulletin.DownloadChapter 1. Global agroclimatic patterns
Chapter 1 describes the CropWatch agroclimatic indicators for rainfall (RAIN), temperature (TEMP), and radiation (RADPAR), along with the agronomic indicator for potential biomass (BIOMSS) for sixty-five global Mapping and Reporting Units (MRU). Indicator values for all MRUs are provided in Annex A.DownloadChapter 2. Crop and environmental conditions in major production zones
Chapter 2 presents the same indicators—RAIN, TEMP, RADPAR, and BIOMSS—used in Chapter 1 and combines them with agronomic indicators—cropped arable land fraction (CALF) and maximum vegetation condition index (VCIx)—to describe crop and environmental conditions in seven global major production zones (MPZ).DownloadChapter 3. Main producing and exporting countries
Building on the global patterns presented in previous chapters, this chapter assesses the situation of crops in 30 key countries that represent the global major producers and exporters or otherwise are of global or CropWatch relevance. For each country, maps and figures present NDVI-based crop condition development, maximum VCI, and spatial NDVI patterns with associated NDVI profiles. Additional information about the various indicators by country and revised 2014-15 production estimates for Argentina, Australia, and Brazil are provided in Annexes A and B, respectively.DownloadChapter 4. China
Chapter 4 presents a detailed CropWatch analysis for China, focusing on the seven most productive agro-ecological regions of the east and south: Northeast China, Inner Mongolia, Huanghuaihai, Loess region, Lower Yangtze, Southwest China, and Southern China. After a brief overview of the 2014-15 winter crops growing season, detailed analyses are provided for individual regions. Additional information on the agroclimatic indicators for agriculturally important Chinese provinces are provided in table A.11 in Annex A.DownloadChapter 5. Focus and perspectives
This focus section complements CropWatch analyses presented in chapters 1 through 4 by presenting additional information about topics of interest to global agriculture. Section 5.1 summarizes disaster events that took place during the reporting period for this bulletin. Sections 5.2 and 5.3 respectively focus on agricultural developments in Africa (Section 5.2) and provide an update on El Nino (5.3).DownloadAnnex A. Agroclimatic indicators
Tables in this Annex provide additional information about the agroclimatic indicators—RAIN, TEMP, and RADPAR—as well as BIOMSS for the various CropWatch spatial units. Those units include the Monitoring and Reporting Units (MRU); the thirty-one main producing and exporting countries; regions or provinces within large countries—Argentina, Australia, Brazil, Canada, India, Kazakhstan, Russia, and the United States; and China.DownloadAnnex B. 2014-2015 Production estimates
Annex B includes tables with the revised 2014-2015 production estimates for wheat in Argentina, Australia, and Brazil.DownloadAnnex C. Quick reference guide to CropWatch indicators, spatial units, and production estimation methodology
Annex C presents a brief overview of the CropWatch indicators and spatial units (including the MRUs, MPZs, and countries), along with a description of the CropWatch production estimation methodology.Download

