-
The current reporting period from April to July 2015 covers the harvest of winter crops and the growth of summer crops in the northern hemisphere, as well as the growth and harvest of winter crops in the southern hemisphere. After providing an overview of global agroclimatic conditions with some typical agronomic impacts in the major production zones (MPZs), the bulletin looks in detail at the major producers, including China, focusing on maize, rice, wheat, and soybeans. A particular focus area for this bulletin is production and trends in North America. The bulletin also includes a new section (4.2) on the impacts of pests and diseases on agriculture in China
Key messages from the report:
- Global environmental conditions. Globally, rainfall—as indicated by the CropWatch RAIN indicator—exceeded average by 4%, while temperature (TEMP) was 0.4°C above average. The resulting biomass production potential (BIOMSS) was 1% above the five-year average. Sunshine (measured by RADPAR) was average.
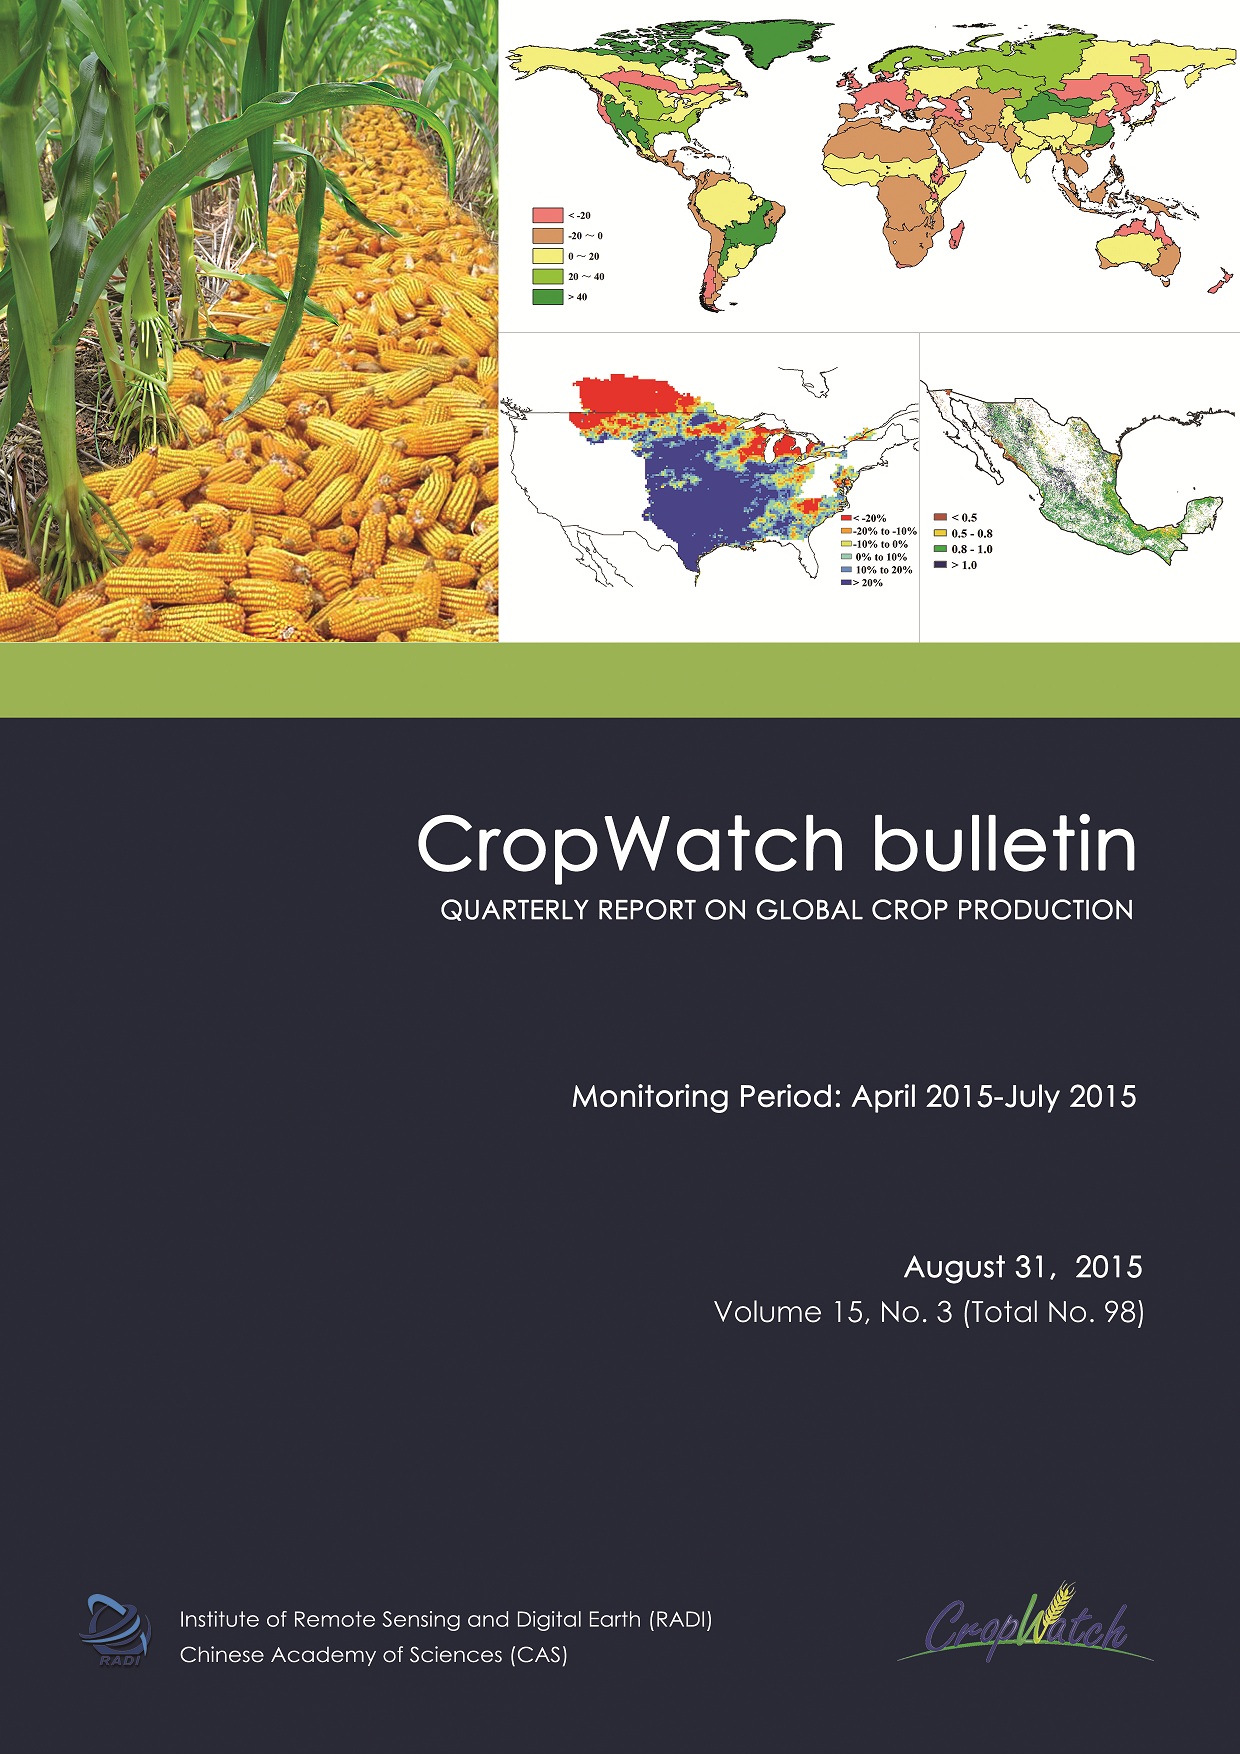
- Patterns of extreme conditions. Selected extreme conditions included high temperature and rainfall in parts of central Asia; drought in selected temperate areas in Asia and Africa; rainfall deficits in East Asia; rainfall deficit and high temperature in Eurasia; and drought and flood in North America.
- Cyclones and storms in Asia. In southern and eastern Asia, cyclones (such as Chan-hom), storms, and intense monsoon precipitation caused loss of life, flooding, damage to infrastructure, and crop loss. India rice production is projected by CropWatch to decrease 3%.
- Global 2015 production outputs. The latest CropWatch production estimates for 2015 are as follows: maize, 987 million tons (comparable to 2014); rice, 741 million tons (comparable to 2014); wheat, 725 million tons (1% increase), and soybean: 310 million tons (1% increase).
- China production estimates. CropWatch puts the total annual output for 2015 at 567.7 million tons (0.7% up from 2014), of which the total production of summer crops in China is 406.9 million tons, an increase of 0.5% compared to 2014; total winter crops production is revised to 125.7 million tons, 0.3 percentage points (equivalent to 317 thousand tons) up from the previous estimates; early rice production is at 35.1 million tons, 1% decrease from the previous year.
- Projections for each crop type are: maize, 192.8 million tons (slight increase compared to 2014); soybean, 12.7 million tons (3% decrease); wheat, 121.6 million tons (2% increase); and rice, 202.3 million tons (1% increase).
- Pests and diseases. Over the reporting period, about two thirds of all rice growing areas in China were affected by planthoppers, while a third suffered from rice sheath blight. Maize was slightly affected by armyworms.
Introduction
The current reporting period from April to July 2015 covers the harvest of winter crops and the growth of summer crops in the northern hemisphere, as well as the growth and harvest of winter crops in the southern hemisphere. After providing an overview of global agroclimatic conditions with some typical agronomic impacts in the major production zones (MPZs), the bulletin looks in detail at the major producers, including China, focusing on maize, rice, wheat, and soybeans. A particular focus area for this bulletin is production and trends in North America. The bulletin also includes a new section (4.2) on the impacts of pests and diseases on agriculture in China.DownloadChapter 1. Global agroclimatic patterns
Chapter 1 describes the CropWatch agroclimatic indicators for rainfall (RAIN), temperature (TEMP), and radiation (RADPAR), along with the agronomic indicator for potential biomass (BIOMSS) for sixty-five global Mapping and Reporting Units (MRU). Indicator values for all MRUs are provided in Annex A.DownloadChapter 2. Crop and environmental conditions in major production zones
Chapter 2 presents the same indicators—RAIN, TEMP, RADPAR, and BIOMSS—used in Chapter 1 and combines them with agronomic indicators—cropped arable land fraction (CALF) and maximum vegetation condition index (VCIx)—to describe crop and environmental conditions in six global major production zones (MPZ).DownloadChapter 3. Main producing and exporting countries
Building on the global patterns presented in previous chapters, this chapter assesses the situation of crops in 30 key countries that represent the global major producers and exporters or otherwise are of global or CropWatch relevance. In addition, the overview section (3.1) pays attention to other countries, to provide some spatial and thematic detail to the overall features described in section 1.1. In section 3.2, maps and figures for all 30 counties monitored present NDVI-based crop condition development, maximum VCI, and spatial NDVI patterns with associated NDVI profiles. Additional information about the various indicators by country and 2015 production estimates for Argentina, Brazil, Canada, and the United States are provided in Annexes A and B, respectively.DownloadChapter 4. China
Chapter 4 presents a detailed analysis for China, focusing on the seven most productive agro-ecological regions of the east and south. After a brief overview of the agro-climatic and agronomic conditions over the monitoring period (section 4.1), a new bulletin section (4.2) describes the situation with pests and diseases that are affecting agricultural crops in China. Section 4.3 then presents an outlook for 2015 production of maize, rice, wheat, and soybean, while section 4.4 presents analyses by region. Additional information on the agroclimatic indicators for agriculturally important Chinese provinces are listed in table A.11 in Annex A.DownloadChapter 5. Focus and perspectives This
This focus section complements CropWatch analyses presented in chapters 1 through 4 by presenting additional information about topics of interest to global agriculture. Section 5.1 presents a production outlook for 2015, while the other three sections focus on disaster events (5.2), agricultural developments in North America (section 5.3), and an update on El Niño (5.4).DownloadAnnex A. Agroclimatic indicators and BIOMSS
Tables in this Annex provide additional information about the agroclimatic indicators—RAIN, TEMP, and RADPAR—as well as BIOMSS for the various CropWatch spatial units. Those units include the Monitoring and Reporting Units (MRU); the thirty-one main producing and exporting countries; and regions or provinces within large countries—Argentina, Australia, Brazil, Canada, India, Kazakhstan, Russia, and the United States; and China.DownloadAnnex B. 2015 production estimates
Annex B includes tables with 2015 production estimates for Argentina, Brazil, Canada, and the United States.DownloadAnnex C. Quick reference guide to CropWatch indicators, spatial units, and production estimation methodology
Annex C presents a brief overview of the CropWatch indicators and spatial units (including the MRUs, MPZs, and countries), along with a description of the CropWatch production estimation methodology.Download

