-
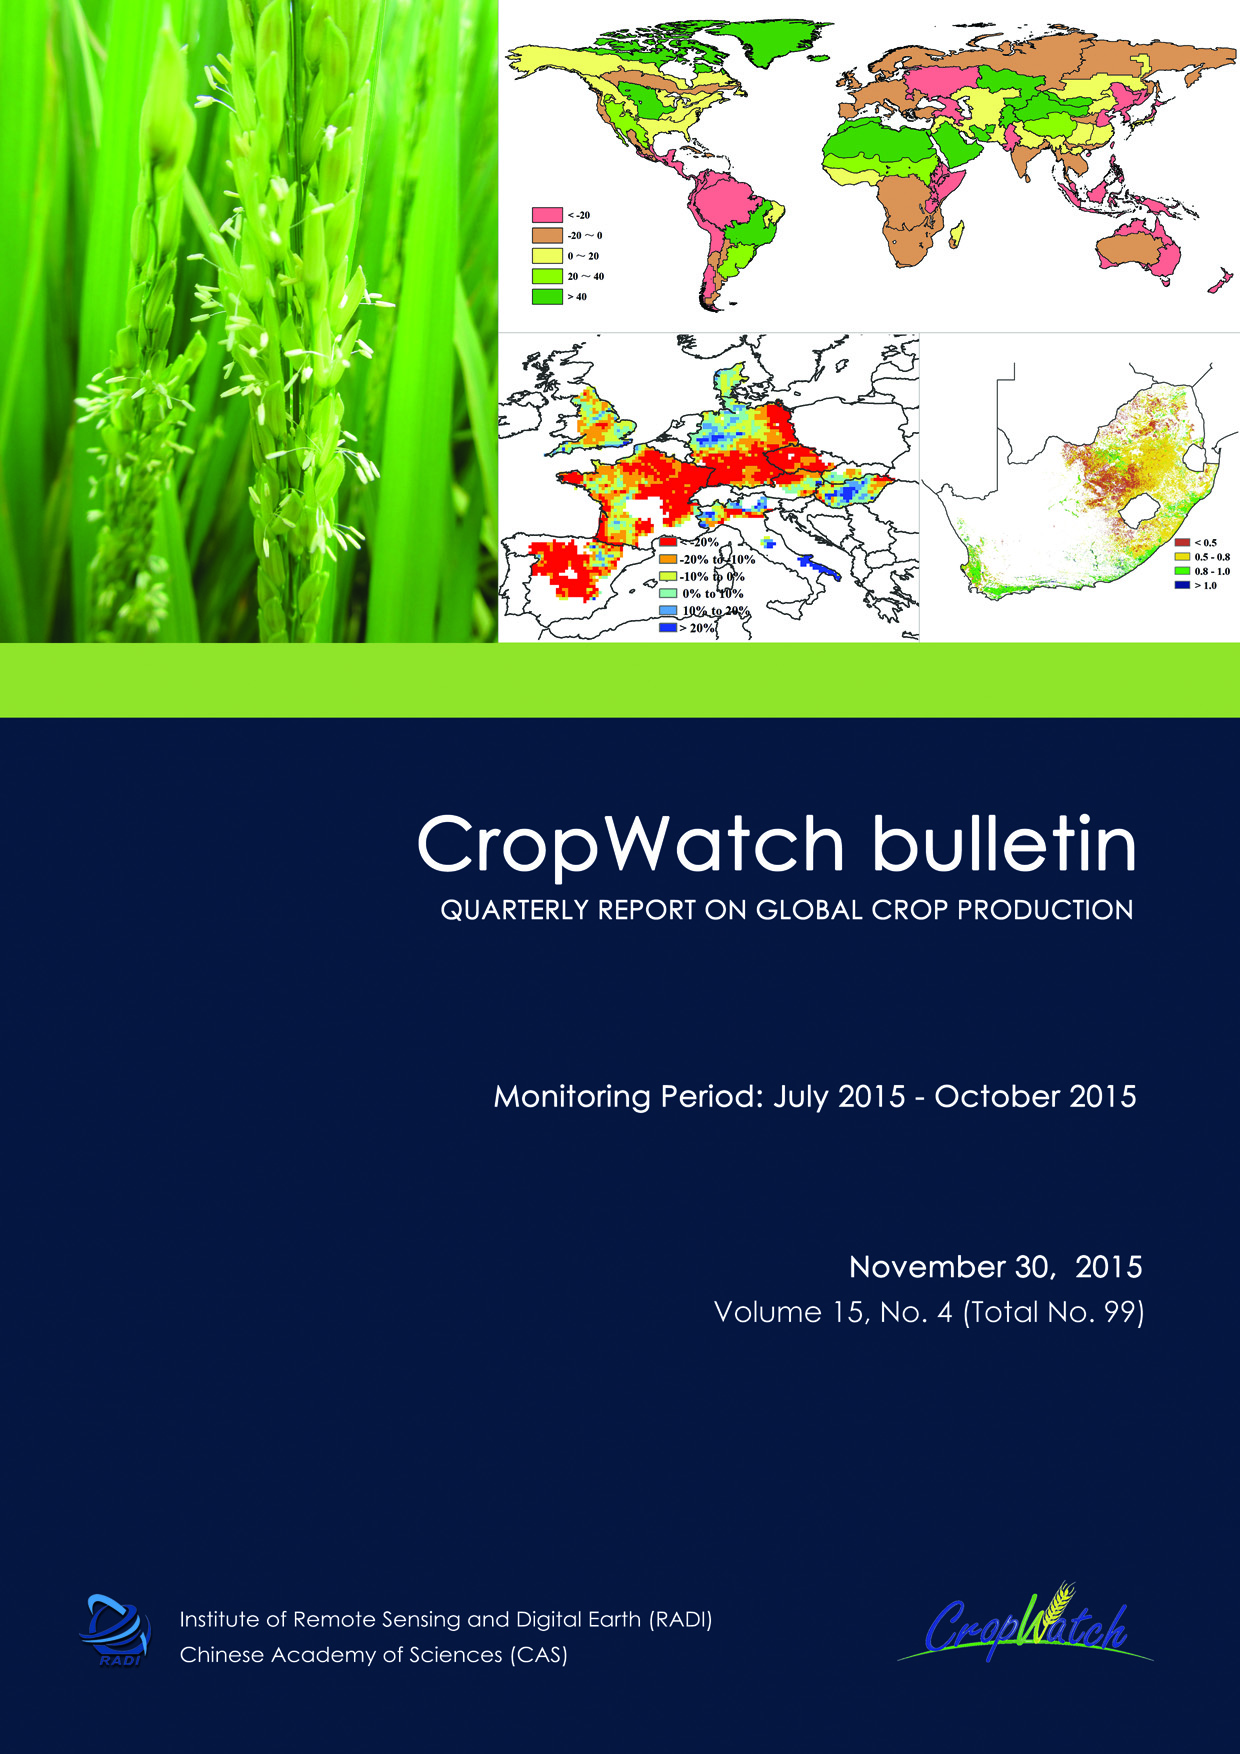
November 2015 CropWatch bulletin released. The latest CropWatch bulletin assesses worldwide food production and other events of agricultural interest for the period July-November 2015. The bulletin as always relies on environmental and satellite-based agronomic indicators combined with other available agricultural data. A particular focus area for this bulletin is production and trends in Europe; The issue further describes other ongoing trends, a production outlook for 2015, disaster events, and El Niño.
Key messages from the report:
- Global environmental conditions. Global patterns of agroclimatic variables bear the stamp of El Niño, with spatially coherent areas of rainfall, and sunshine anomalies. The resulting biomass production potential (BIOMSS) anomalies follow similar patterns. El Niño conditions are likely to persist at least up to the end of the year.
- Patterns of abnormal conditions. Abundant rainfall over many semi-arid areas has favored crops, rangeland and livestock developments, and replenished soil moisture reserves. This includes two main areas: Bolivia, Paraguay and southern Brazil, as well as a huge stretch of land from the west African Sahel (Mauritania, Senegal) to north Africa, the Middle East and as far as Central Asia and Xinjiang.
- Drought is reported from (1)southern and Central America, including the Caribbean Islands, the Dry Corridor and Colombia to northern Brazil as well as much of the Southern Cone; (2)southern and eastern Africa where millions are in need of food aid; (3)parts of southern Asia (India), eastern Korea and South East Asia, especially Papua New Guinea and Indonesia; (4)Oceania, including New Caledonia and New Zealand and (5)a large area in Eurasia, with deficits increasing from west and north to east.
- Cyclones and storms. No less than ten named tropical cyclones were reported, including the most powerful cyclone ever observed on earth: Patricia.
- Global 2015 production outputs. The latest CropWatch estimates for the 2015 cereals and soybean production puts the total at 990 million tons for maize (unchanged from 2014), 742 million tons for paddy rice (-0.1% compared to 2014), 724 million tons for wheat (up 0.3% from 2014) and 309 million tons for soybean (+1.0%).
- China production estimates. In terms of Chinese production figures, CropWatch estimates 194 million tons for maize (+1%), 202 million tons for rice (+1%), 122 million tons for wheat (+2%) and 13 million tons for soybeans (-1%).
INTRODUCTION
The current reporting period from July to October 2015 mostly covers the planting of summer crops in the southern hemisphere, the harvest of winter crops and summer crops as well as the planting of winter crops in the northern hemisphere. In many tropical and equatorial areas, the period includes the overlapping harvest of a first crop and the planting of the second. After providing an overview of global agroclimatic conditions with some typical agronomic impacts in the major production zones (MPZs), the bulletin looks at the major producers in detail, including China, focusing on maize, rice, wheat, and soybeans, including pest and disease impacts. A particular focus area for this bulletin is production and trends in Europe.DownloadCHAPTER 1
Chapter 1 describes the CropWatch agroclimatic indicators for rainfall (RAIN), temperature (TEMP) and radiation (RADPAR), along with the agronomic indicator for potential biomass (BIOMSS) for sixty-five global Mapping and Reporting Units (MRUs). Indicator values for all MRUs are provided in Annex A.DownloadCHAPTER 2
Chapter 2 presents the same indicators—RAIN, TEMP, RADPAR and BIOMSS—used in Chapter 1 and combines them with agronomic indicators—cropped arable land fraction (CALF) and maximum vegetation condition index (VCIx)—to describe crop and environmental conditions in six global major production zones (MPZ).DownloadCHAPTER 3
Building on the global patterns presented in previous chapters, this chapter assesses the situation of crops in 30 key countries that represent the global major producers and exporters or otherwise are of global or CropWatch relevance. In addition, the overview section (3.1) pays attention to other countries, to provide spatial and thematic details to the overall features described in section 1.1. In section 3.2, maps and figures for all 30 counties monitored present NDVI-based crop condition development, maximum VCI and spatial NDVI patterns with associated NDVI profiles. Additional information about the various indicators by country and 2015 production estimates for Argentina, Australia, Brazil, Canada and the United States are provided in Annexes A and B, respectively.DownloadCHAPTER 4
Chapter 4 presents a detailed analysis for China, focusing on the seven most productive agro-ecological regions of the east and south. After a brief overview of the agroclimatic and agronomic conditions over the monitoring period (section 4.1), a new bulletin section (4.2) describes the situation with pests and diseases that are affecting agricultural crops in China. Section 4.3 then presents an outlook for 2015 production of maize, rice, wheat, and soybean, while section 4.4 presents analyses by region. Additional information on the agroclimatic indicators for agriculturally important Chinese provinces is listed in table A.11 in Annex A.DownloadCHAPTER 5
This focus section complements CropWatch analyses presented in chapters 1 through 4 by presenting additional information about topics of interest to global agriculture. Section 5.1 presents the global production outlook for 2015, while the other three sections focus on disaster events (5.2), agricultural developments in Europe (section 5.3), and an update on El Niño (5.4).DownloadAnnex A. Agroclimatic indicators and BIOMSS
Tables in this Annex provide additional information about the agroclimatic indicators—RAIN, TEMP and RADPAR—as well as BIOMSS for the various CropWatch spatial units. Those units include the Monitoring and Reporting Units (MRU); the thirty-one main producing and exporting countries; and regions or provinces within large countries—Argentina, Australia, Brazil, Canada, India, Kazakhstan, Russia, and the United States; and China.DownloadAnnex B. 2015 production estimates
Annex B includes tables with 2015 production estimates for Argentina, Australia, Brazil, Canada and the United States.DownloadAnnex C. Quick reference guide to CropWatch indicators, spatial units, and production estimation methodology
Annex C presents a brief overview of the CropWatch indicators and spatial units (including the MRUs, MPZs, and countries), along with a description of the CropWatch production estimation methodology.Download

