-
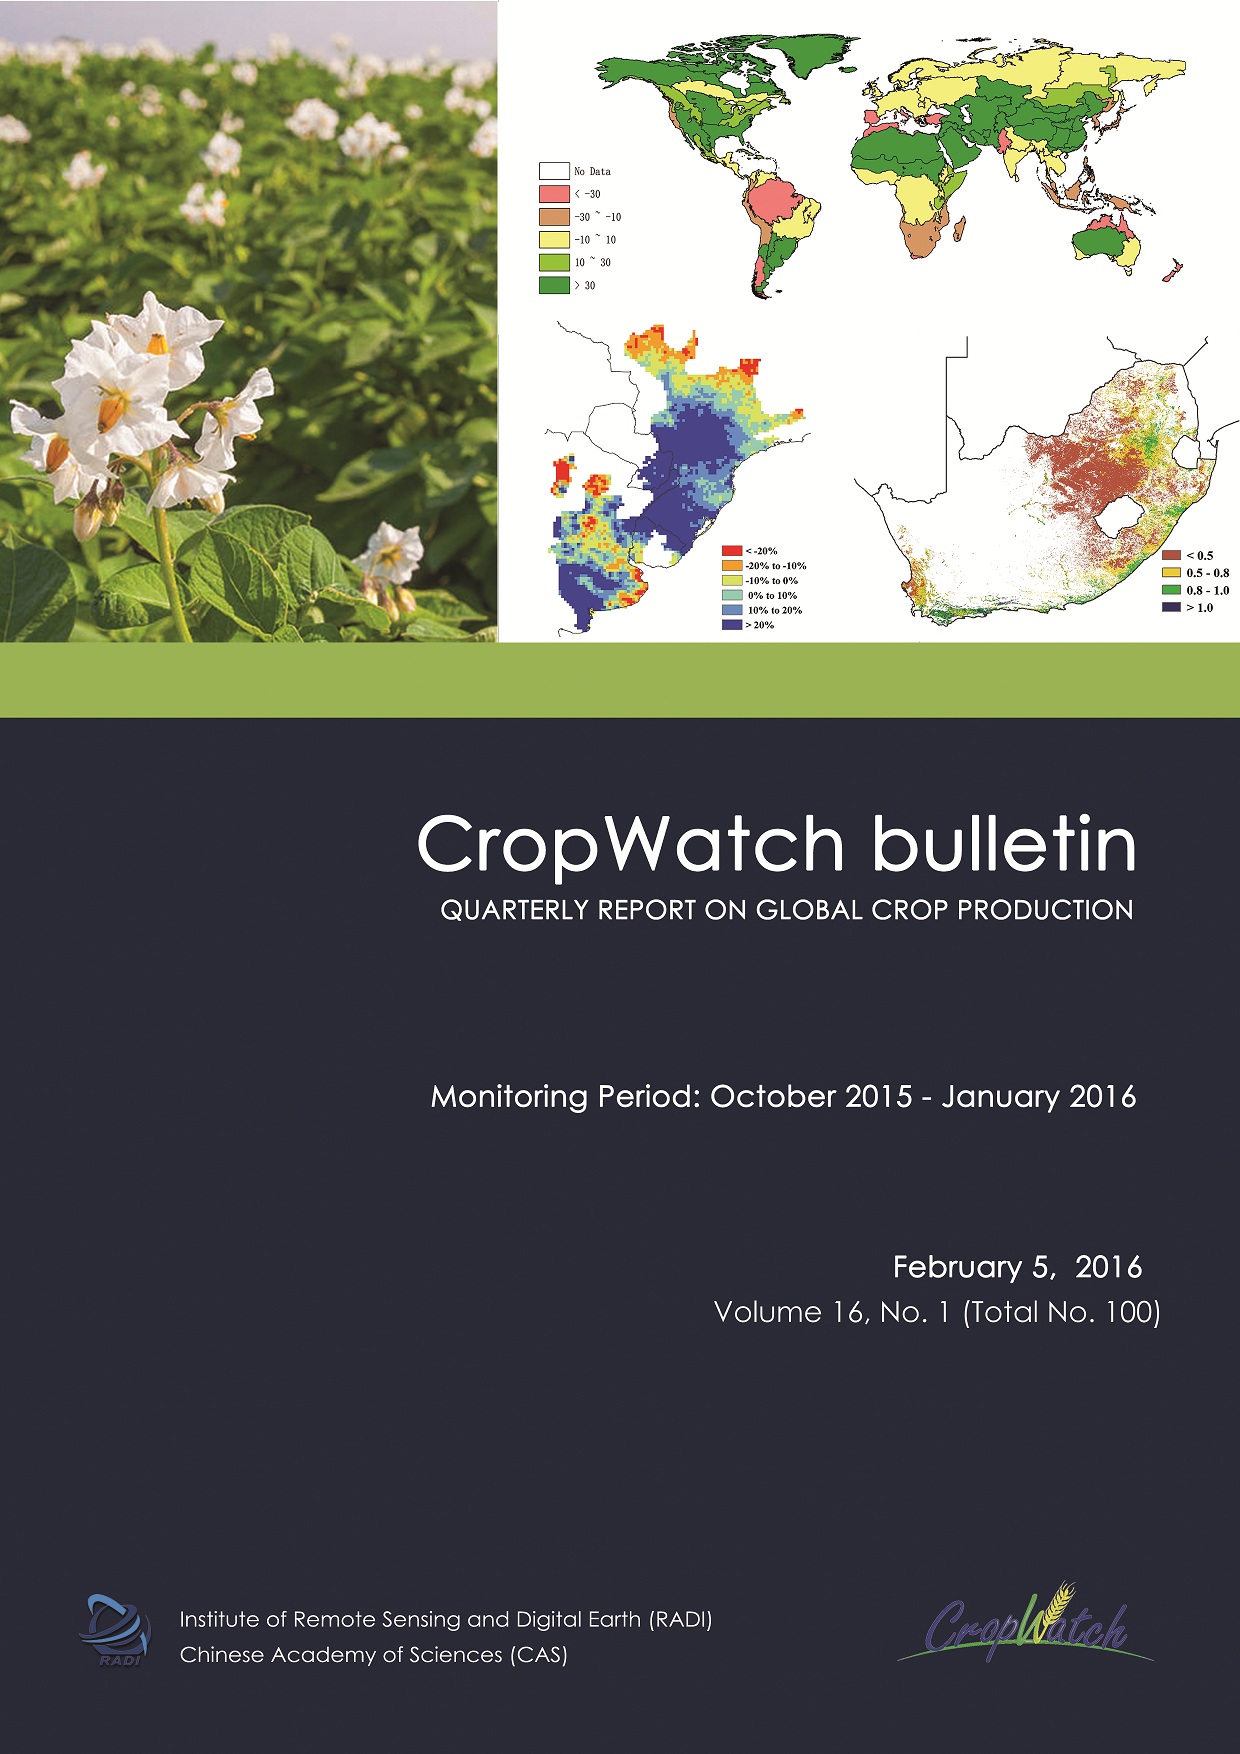
February 2016 CropWatch bulletin released. The latest CropWatch bulletin assesses worldwide food production and other events of agricultural interest for the period October 2015 to January 2016. The bulletin as always relies on environmental and satellite-based agronomic indicators combined with other available agricultural data. A particular focus area for this bulletin is the Zambezi basin in Africa; the issue further describes other ongoing trends, a focus on Chinese domestic crop prices, disaster events, and El Niño.
Key messages from the report:
- Global environmental conditions. Global patterns of agroclimatic variables bear the stamp of El Niño, with spatially coherent areas of rainfall, and sunshine anomalies. The resulting biomass production potential (BIOMSS) anomalies follow similar patterns. While El Niño had an impact during this reporting period, effects are likely to slow down.
- Patterns of abnormal conditions.On one hand, abundant rainfallwas seen throughout China, most of Central Asia and the Middle East, as well as sub-Saharan Northern Africa. Drought, on the other hand, was reported on an especially large scale in Southern Africa, the Horn of Africa, parts of Latin America and the Mediterranean.
- Floods. Floods hit all continents during the reporting period, with areas affected most including the USA, Egypt, Saudi Arabia, Kenya, the DRC, a large area throughout south America, Somalia, Iraq, India and Malaysia.
- Southern hemisphere updates:total wheat production of Argentina, Australia and Brazil stands at 43 million tons, 1378 ktons decrease from the previous year. Maize output of South Africa will drop from 13.2 million tons to 7.3 million tons, a 45% reduction due to the severe drought.
INTRODUCTION
The current reporting period from October 2015 to January 2016 is a relatively quiet period from an agricultural point of view. In the temperate northern hemisphere, summer crops have been harvested while winter crops lay dormant. In some tropical and equatorial countries, this period involves the planting of the second maize and rice. After providing an overview of global agroclimatic conditions with some typical agronomic impacts in the major production zones (MPZs), the bulletin looks at the major producers in detail, including China, focusing on maize, rice, wheat, and soybeans, including a look at domestic prices. A particular focus area for this bulletin is the Zambezi region.DownloadCHAPTER 1
Chapter 1 describes the CropWatch agroclimatic indicators for rainfall (RAIN), temperature (TEMP) and radiation (RADPAR), along with the agronomic indicator for potential biomass (BIOMSS) for sixty-five global Mapping and Reporting Units (MRUs). Indicator values for all MRUs are provided in Annex A.DownloadCHAPTER 2
Chapter 2 presents the same indicators—RAIN, TEMP, RADPAR and BIOMSS—used in Chapter 1 and combines them with agronomic indicators—cropped arable land fraction (CALF) and maximum vegetation condition index (VCIx)—to describe crop and environmental conditions in six global major production zones (MPZ).DownloadCHAPTER 3
Building on the global patterns presented in previous chapters, this chapter assesses the situation of crops in 30 key countries (between October 2015 and January 2016) that represent the global major producers and exporters or otherwise are of global or CropWatch relevance. In addition, the overview section (3.1) pays attention to other countries, to provide spatial and thematic details to the overall features described in section 1.1. In section 3.2, maps and figures for all 30 counties monitored present NDVI-based crop condition development, maximum VCI and spatial NDVI patterns with associated NDVI profiles. Additional information about the various indicators by country and 2015 production estimates for Argentina, Australia, Brazil, Canada and the United States are provided in Annexes A and B, respectively.DownloadCHAPTER 4
Chapter 4 presents a detailed analysis for China, focusing on the seven most productive agro-ecological regions of the east and south. After a brief overview of the agroclimatic and agronomic conditions over the monitoring period (section 4.1), a new bulletin section (4.2) describes the outlook of domestic price of four crops. Section 4.3 then presents analyses by region. Additional information on the agroclimatic indicators for agriculturally important Chinese provinces is listed in table A.11 in Annex A.DownloadCHAPTER 5
This focus section complements CropWatch analyses presented in chapters 1 through 4 by presenting additional information about topics of interest to global agriculture. Section 5.1 presents a focus on disaster events, while the rest of the chapter look at updates in the southern hemisphere (5.2), the Zambezi region (5.3), and an update on El Niño (5.4).DownloadTables in this Annex provide additional information about the agroclimatic indicators—RAIN, TEMP and RADPAR—as well as BIOMSS for the various CropWatch spatial units. Those units include the Monitoring and Reporting Units (MRU); the thirty-one main produc
Tables in this Annex provide additional information about the agroclimatic indicators—RAIN, TEMP and RADPAR—as well as BIOMSS for the various CropWatch spatial units. Those units include the Monitoring and Reporting Units (MRU); the thirty-one main producing and exporting countries; and regions or provinces within large countries—Argentina, Australia, Brazil, Canada, India, Kazakhstan, Russia, and the United States; and China.DownloadAnnex B. 2015-2016 production estimates
Annex B includes tables with 2015 production estimates for Argentina, Australia, Brazil.DownloadAnnex C. Quick reference guide to CropWatch indicators, spatial units, and production estimation methodology
Annex C presents a brief overview of the CropWatch indicators and spatial units (including the MRUs, MPZs, and countries), along with a description of the CropWatch production estimation methodology.Download

