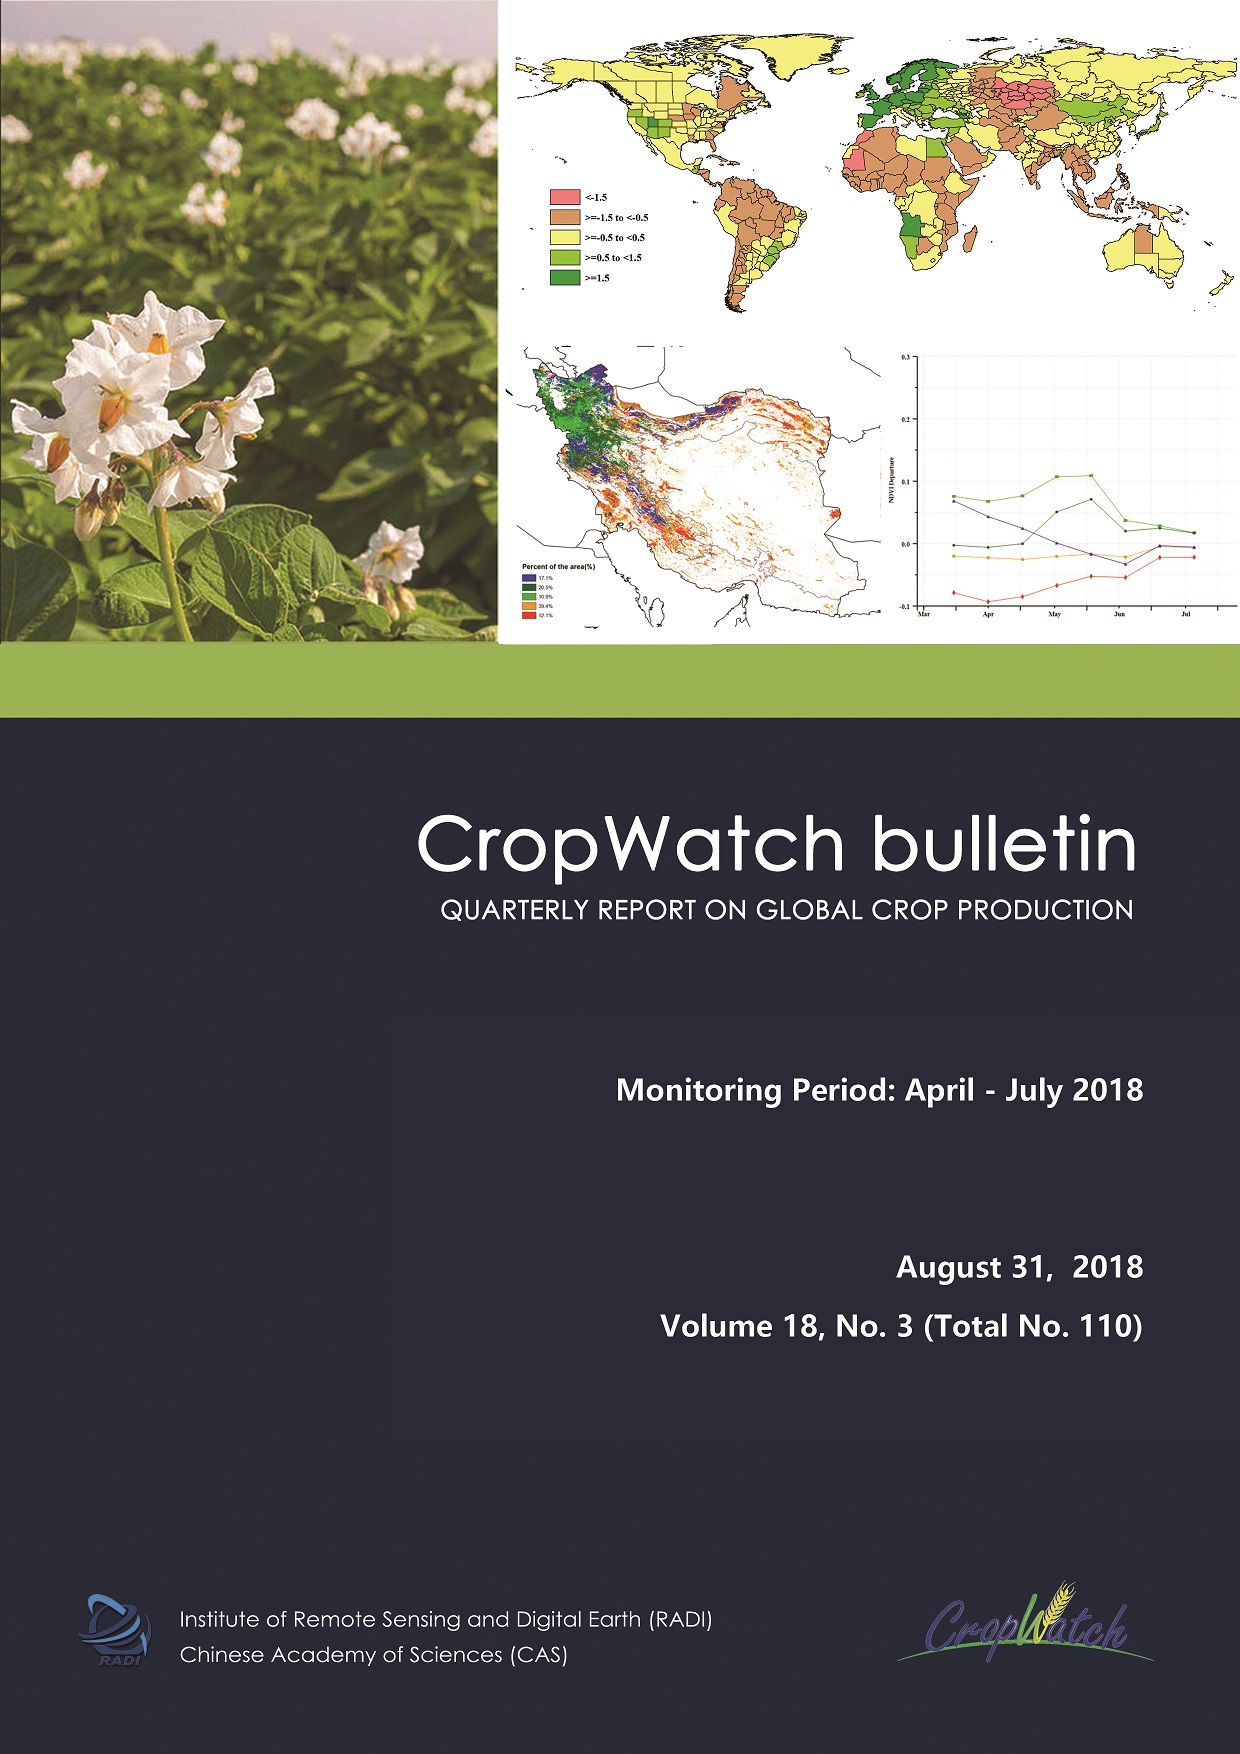
-
August CropWatch Bulletin is based mainly on current remote sensing inputs in addition to detailed and spatially accurate reference data about crops and their management. The scope is global and comprehensive. Focusing on the months of April to July 2018, chapters cover global, national, and regional-level agroclimatic conditions and the condition of crops that were growing or harvested during this time. For China, the bulletin presents China crop production, crop conditions for each of seven key agro-ecological zones, regional impacts of pests and diseases as well as trade prospects (import/export) of major crops. The focus section reports on food production estimates, recent disaster events with an impact on agriculture, and the possibility of an El Niño event.
Key messages from the report:
- There are dry conditions in North American western coastal areas, significant warming in northern high latitude areas and relatively wet conditions in the semiarid area extending from northern Africa (Sahel) across the Arabian Peninsula to Mongolia and beyond. Large monitoring areas had below average sunshine, resulting in a global sunshine drop of 2% over all agricultural areas and drought prevailed at high latitudes in both hemispheres.
- Global crop production: CropWatch estimates the global 2018 production of the major commodities at 1011 million tons of maize, down 0.1% from 2017, 727 million for rice (up 1.7%), 702 million tons of wheat (with a 2.4% decrease below 2017 output) and 320 million tons of soybeans, down 1.0%.
- China crop production: The total annual crop production is estimated at 577 million tons down 0.9% from 2017 (2.46 million tons decrease). CropWatch forecasts the rice production for China at 196 million tons, 2% below 2017 and soybean production at 14.2 million tons (+3% from 2017).
- Disaster: Drought is reported from several areas across all continents. Floods happened in the Horn of Africa and surrounding regions, together with several areas in Asia. The situation of cyclones was relatively calm during the reporting period.
- El Niño: El Nino conditions have been neutral across the Pacific Ocean during the second quarter of 2018.
Introduction
This version summarizes global crop condition developments and agroclimatic factors from April 1 to July 31, 2018 through 4 zoom in from a global overview of agroclimatic indicators (Chapter 1) to detailed descriptions of crop and environmental conditions in large production zones (Chapter 2), to individual country analyses covering 41 major producers and exporters including agro-ecological zones (Chapter 3) and China (Chapter 4). A special focus section is included in Chapter 5, covering crop production for 2018, disaster events, and an update on El Niño. This first part of the report includes the cover, table of contents, abbreviations, a short overview of the different sections of the bulletin and executive summary.DownloadChapter 1. Global agroclimatic patterns
Chapter 1 describes the CropWatch Agroclimatic Indicators (CWAIs); rainfall (RAIN), temperature (TEMP), and radiation (RADPAR), along the agronomic indicator for potential biomass (BIOMSS) in sixty-five global Monitoring and Reporting Units (MRU). Rainfall, temperature, and radiation indicators are compared to their average value for the same period over the last fifteen years (called the “average”), while BIOMSS is compared to the indicator’s average of the recent five years. Indicator values for all MRUs are included in Annex A table A.1. For more information about the MRUs and indicators, please see Annex C .DownloadChapter 2. Crop and environmental conditions in major production zones
Chapter 2 presents the same indicators—RAIN, TEMP, RADPAR, and BIOMSS—used in Chapter 1 and combines them with agronomic indicators—cropped arable land fraction (CALF), maximum vegetation condition index (VCIx), and minimum vegetation health index (VHIn)—to describe crop and environmental conditions in six global major production zones (MPZ): West Africa, North America, South America, South and southeast Asia, Western Europe, and Central Europe to western Russia (See also Annex C for more information about these zones).DownloadChapter 3. Main producing and exporting countries
Chapter 3 offers a closer look at individual countries. This chapter assesses the situation of crops in 41 key countries that represent the global major producers and exporters or otherwise are of global or CropWatch relevance. First, the overview section (3.1) pays attention to all countries worldwide, to provide some spatial and thematic detail to the overall features described in section 1.1. In section 3.2, more detail is provided for each of the CropWatch monitored countries, including analyses by key agro-ecological zones within the country. For each country, maps are included illustrating NDVI-based crop condition development graphs, maximum VCI, and spatial NDVI patterns with associated NDVI profiles. Additional information about indicators per country is provided in Annex A, while Annex B provides 2018 production estimates for select countries at provincial/state level.DownloadChapter 4. China
After a brief overview of the agroclimatic and agronomic conditions in China over the reporting period (section 4.1), Chapter 4 describes the China crop production (4.2) and the situation by region, focusing on the seven most productive agro-ecological regions of the east and south: Northeast China, Inner Mongolia, Huanghuaihai, Loess region, Lower Yangtze, Southwest China, and Southern China (4.3). Section 4.4 presents the results of ongoing pests and diseases monitoring, while sections 4.5 describe trade prospects (import/export) of major crops. Additional information on the agroclimatic indicators for agriculturally important Chinese provinces is listed in table A.11 in Annex A.DownloadChapter 5. Focus and perspectives
Building on the CropWatch analyses presented in chapters 1 through 4, this chapter presents initial CropWatch food production estimates for 2018 (section 5.1), as well as sections on recent disaster events (section 5.2), and an update on El Niño (5.3).DownloadAnnex A. Agroclimatic indicators
Tables in this Annex provide additional information about the agroclimatic indicators—RAIN, TEMP, and RADPAR—as well as BIOMSS for the various CropWatch spatial units. Those units include the Monitoring and Reporting Units (MRU); the thirty-one main producing and exporting countries; and regions or provinces within large countries—Argentina, Australia, Brazil, Canada, India, Kazakhstan, Russia, and the United States; and China.DownloadAnnex B. 2018 Production estimates
Annex B includes tables with 2018 CropWatch production estimates for Argentina, Brazil, Canada, Australia, and the United States.DownloadAnnex C. Quick reference guide to CropWatch indicators, spatial units and methodologies
Annex C presents a brief overview of the CropWatch indicators and spatial units (including the MRUs, MPZs, and countries), along with a description of the CropWatch production estimation methodology and methodology to determine the severity of the occurrence.Download

